
28
Volume 42 Issue 2
Tables (7)
and
(8)
in the annex show world oil demand and supply for
the period 2013-2015.
US tight oil production
In December 2015, US tight oil production decreased by 96 thousand
b/d or 1.9% comparing with the previous month level to reach 5.052million
b/d, representing a decrease of 291 thousand b/d from their last year level.
The US oil rig count decreased by 30 rig comparing with the previous
month level to reach 474 rig, a level that is 791 rig lower than last year, as
shown in
table (3)
and
figure (7)
:
Source: EIA, Drilling Productivity Report for key tight oil and shale gas regions, December 2015.
* focusing on the seven most prolific areas, which are located in the Lower 48 states. These seven
regions accounted for 95% of domestic oil production growth during 2011-13 (Bakken, Eagle Ford
،
Haynesville
،
Marcellus
،
Niobrara
،
Permian
،
Utica)
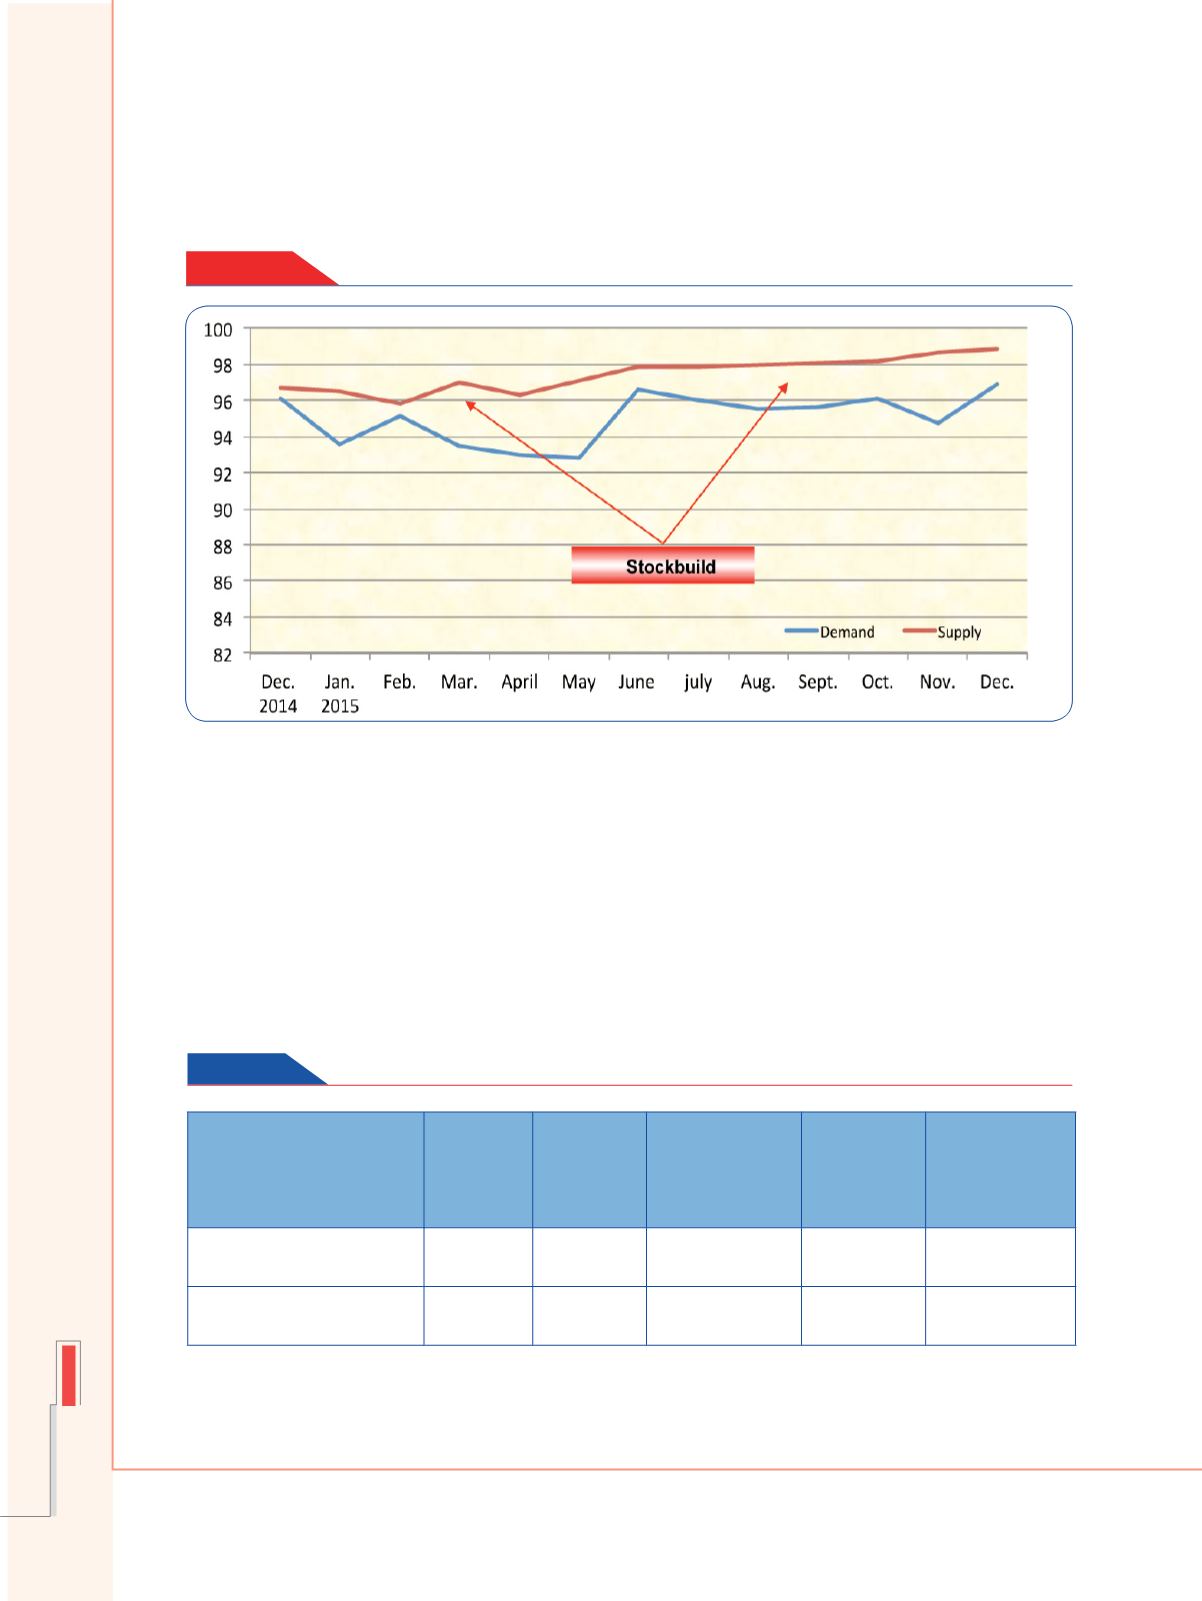
Figure - 6
World Supply and Demand
(Million b/d)
Table 3
US* tight oil production
(Million b/d)
Change from
December
2014
December
2014
Change from
November
2015
November
2015
December
2015
-0.291
5.343
-0.096
5.148
5.052
tight oil production
-791
1265
-30
504
474
Oil rig count (rig)


