85
CHAPTER ONE
Developments in Global Markets
Fig 1/23
Fig 1/24
0
Algeria
Bahrain
Egypt
Iraq
Kuwait
Libya
Qatar
S. Arabia
Syria
Tunisia
UAE
0
50
100
150
200
250
300
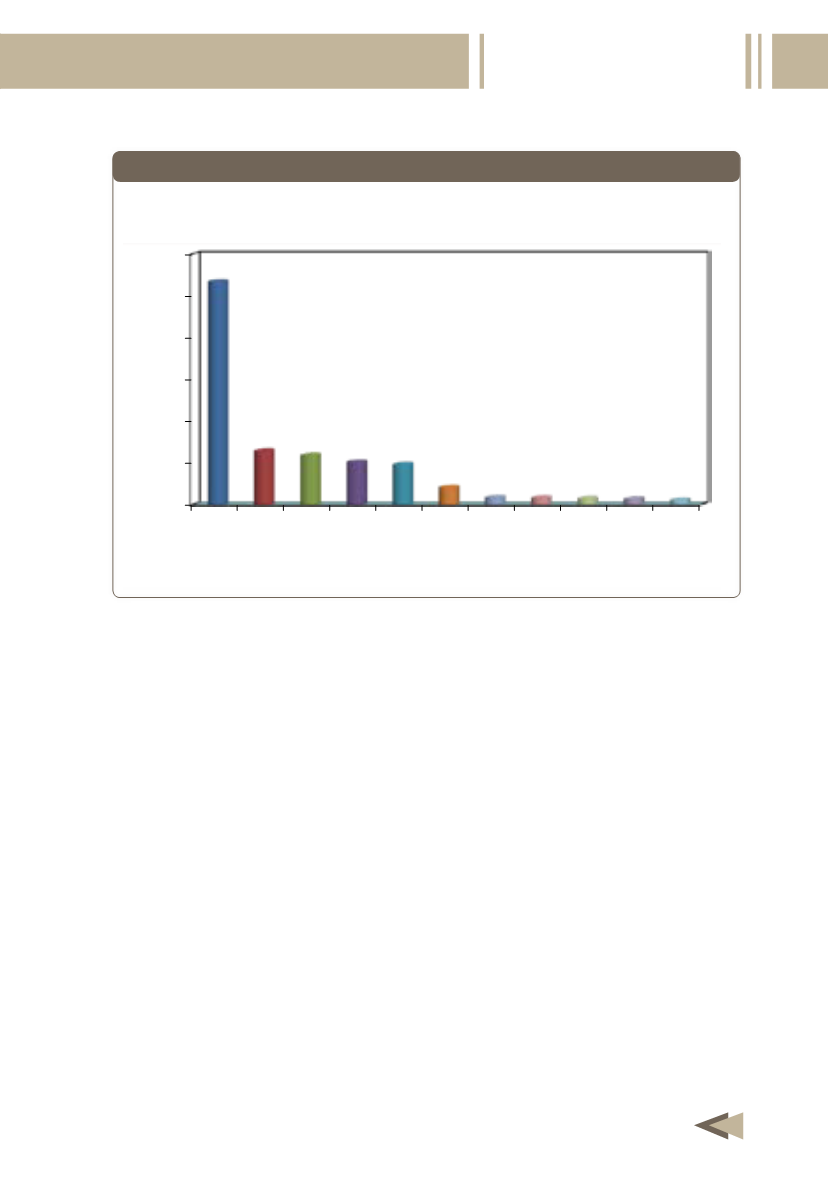
Qatar
UAE
Kuwait
Bahrain
S. Arabia
Libya
Algeria
Iraq
Egypt
Syria
Tunisia
0
1000
2000
3000
4000
5000
6000
7000
Petroleum products Natural Gas Hydroelectricity
Coal
Figure 1-23
Per Capita Energy Consumption in OAPEC Member Countries, 2012
(boe)
2-2 Energy Consumption by Source
Energy consumption in OAPEC member countries increased by
a rate of 5.3% per annum during the period 2009-2012 as it rose
from 10.5 million boe/d in 2009 to 12.3 million boe/d in 2012. The
substitution policy of natural gas for petroleum products pursued by
OAPEC member countries led natural gas to occupy the first place
in meeting the energy requirements in OAPEC member countries
starting from the year 2009 .
During the period 2009-2012 the relative importance of natural
gas in total consumption has increased from 51.3% in 2009 to 53.2%
in 2012. At the same time the share of petroleum products fell from
47.8% to 45.9%. There are no reliable non-petroleum sources that
member countries can rely on, as all available sources of hydroelectric
power and coal representing small fraction in their energy mix.


